Orleans ranks 15th among counties in NYS for ag revenue
Cayuga dethrones Wyoming County as state’s top ag producer

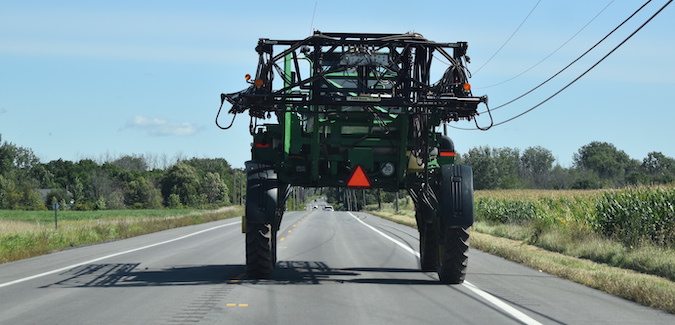
Photo by Tom Rivers: Farm equipment heads down Route 31 in Ridgeway on Sept. 19, 2023. Agriculture is a huge economic driver in Orleans County.

The county’s revenue for farm products sold totaled $233.6 million, up 50.4 percent from the $155.3 million in 2017, a growth of $78.3 million
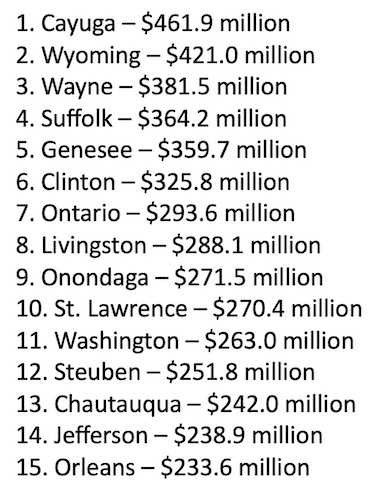
The county’s ag bounty is only about half of the state’s top county for agricultural revenue. Cayuga tops the 62 counties at $461.9 million. Cayuga also dethroned Wyoming as the state’s agricultural king.
The ag census is done every five years. During the previous census in 2017, Wyoming was the top ag producer at $307.5 million, followed by Cayuga at $287.9 million, Genesee in third at $234.9 million, Suffolk at fourth $225.6 million and Wayne in fifth at $221.3 million.
With the new ag census, Genesee drops from third to fifth, while Wayne jumps up two spots to third place.
Overall, statewide ag revenue was $8.04 billion in 2022, up by 49.7 percent from the $5.37 billion in 2017.
The 2022 Ag Census was released on Tuesday by the National Agricultural Statistics Service.
Here are the ag revenues for the 62 counties in NYS:
- Albany – $47.9 million
- Allegany – $69.8 million
- Bronx – D (withheld)
- Broome – $54.1 million
- Cattaraugus – $144.8 million
- Cayuga – $461.9 million
- Chautauqua – $242.0 million
- Chemung – $34.5 million
- Chenango – $123.0 million
- Clinton – $325.8 million
- Columbia – $111.2 million
- Cortland – $108.1 million
- Delaware – $66.8 million
- Dutchess – $45.1 million
- Erie – $192.0 million
- Essex – $11.8 million
- Franklin – $149.0 million
- Fulton – $9.4 million
- Genesee – $359.7 million
- Greene – $25.0 million
- Hamilton – D (withheld)
- Herkimer – $93.1 million
- Jefferson – $238.9 million
- Kings (Brooklyn) – D (withheld)
- Lewis – $178.6 million
- Livingston – $288.1 million
- Madison – $190.7 million
- Monroe – $101.1 million
- Montgomery – $126.1 million
- Nassau – $8.8 million
- New York (Manhattan) – D (withheld)
- Niagara – $156.9 million
- Oneida – $190.1 million
- Onondaga – $271.5 million
- Ontario – $293.6 million
- Orange – $95.6 million
- Orleans – $233.6 million
- Oswego – $68.9 million
- Otsego – $62.6 million
- Putnam – $1.5 million
- Queens – $285,000
- Rensselaer – $61.9 million
- Richmond (Staten Island) – $79,000
- Rockland – $4.0 million
- St. Lawrence – $270.4 million
- Saratoga – $115.5 million
- Schenectady – $6.4 million
- Schoharie – $63.5 million
- Schuyler – $68.1 million
- Seneca – $110.4 million
- Steuben – $251.8 million
- Suffolk – $364.2 million
- Sullivan – $37.5 million
- Tioga – $67.0 million
- Tompkins – $89.8 million
- Ulster – $105.5 million
- Warren – $2.5 million
- Washington – $263.0 million
- Wayne – $381.5 million
- Westchester – $11.6 million
- Wyoming – $421.0 million
- Yates – $152.4 million
Note: “D” is used in the ag census for a county with few farms to avoid disclosing information on individual producers.


